If this page looks weird, please switch to the light mode.
Network Construction
Networks are a mode of data visualization, which in core contain two elements: nodes and edges. Nodes can represent any kind of entity (e.g. persons, organizations, books, words etc.), while edges display the relationships between them. Edges can be directed (e.g. “Franz sends a letter to Hermann”) or undirected (e.g. “The Metamorphosis and A Hunger Artist are both works by Franz Kafka”). Additionally, edges can be weighted (e.g. “The Metamorphosis and A Hunger Artist have 40 % shared vocabulary”; “The Metamorphosis and The Earthquake in Chile have 4% shared vocabulary”).
In the present research, it is used to investigate underlying linguistic structures in reviews. For this purpose, nodes represent the individual reviews and edges show whether a pair of reviews includes similar features.
Text similarity in this study is operationalized as term frequency-inverse document frequency (TF-IDF), which is a combinational measure that incorporates term frequency and inverse document frequency. Thereby TF-IDF captures the relative importance of a term within a document by considering both its frequency within the document and its occurrence across the entire collection. The resulting document vectors are then compared using cosine similarity.
To avoid any biases for reviews discussing the same book or books by the same author using SpaCyr (Benoit & Matsuo, 2020) Named Entity Recognition – a natural language processing technique that identifies and categorizes named entities, such as persons, locations, organizations, and dates, within a given text – was applied to exclude names, titles and other story-relevant terms. The results were curated manually and an algorithmic approach was implemented to ensure consistent labeling within the same group of reviews that discussed the same book. Furthermore certain words were deemed biasing or unhelpful for the analysis were excluded. This included third person pronouns to prevent connections that were solely based on the gender of either the protagonist or the author or the number of protagonists. Other terms excluded are “the,” “a,” “an,” “of,” “or,” “and,” “to,” “ll,” and “ve”.
The cleaned data was organized into a document feature matrix using the quanteda package (Benoit et al., 2018). In this matrix, each row corresponds to a document, in this case the reviews, and each lemma in the corpus has its own column. The values in the matrix represent the frequency of occurrence for each word within the respective document. Additionally, the package enables the inclusion of document variables, such as review, title, and genre.
Following the creation of the document feature matrix, TF-IDF was calculated and computed to a matrix of distances and similarities between documents based on cosine similarity. The resulting similarity matrix is in itself a complete weighted network, since it displays the connections between every document.
However, in this form, the network is quite dense, which is why a filtering code is employed to extract the network backbone. The filtering code for this study was adopted from Bail (2016), which itself is based on the disparity filter by Bessi and Briatte (2016). It allows to preserve “an edge whenever its intensity is statistically not compatible with respect to a null hypothesis of uniform randomness for at least one of the two nodes the edge is incident to” (Serrano et al., 2009, p. 6487). The statistical threshold (alpha) is thereby defined by the user. In this case, alpha was set to 0.085, which does not entail the standard threshold of statistical significance, but was informed by the resulting network. Setting the threshold to 0.05 resulted in very small clusters, which quite consistently paired nodes corresponding to the same novel, but consequently resulted in a huge loss of data in an already small dataset. Due to the explorative nature of this study that does not aim at statistical representativeness, it was assumed that even these looser connections could be informative and give directions for future studies using a bigger dataset.
To gain comprehensive information from a network structure, it is useful to decompose it into sub-units, so called communities or clusters. In the case of information networks, such as the present one, these can be used to identify common topics (Blondel et al., 2008, p. 11). The community-detection method used in this study is the louvain algorithm as implemented in the igraph package (Csardi & Nepusz, 2006). Here, the core measure for community detection is modularity, which is based on the level of partitioning or division strength within a network. The algorithm tries to maximize modularity in two iterative phases:
- First Phase:
- Assign each node i in a network its own community
- Calculate the modularity for each node i if it was removed from its community and moved into the community of each neighbor j of i
- Place i into the community that resulted in the greatest increase in modularity, if no increase is possible i remains in its original community
- Repeat 1. to 3. until no more increase in modularity occurs
- Second Phase:
- A new meta-network is built whose nodes are the communities of the previous phase
- The edges between the former nodes of the same community are now self-loops and the edges between communities are now weighted by the sum of the edges of the former nodes in the community
- Repeat phase 1
This leads to a decrease in communities in each iteration until modularity has reached its maximum and there are no more changes in the network (Blondel et al., 2008, pp. 3–4). Apart from the communities themselves, “the resulting meta-network, whose nodes are the communities, may then be used to visualize the original network structure.“ (ibid., p. 2) In the present study this is achieved by creating a layout that represents the resulting structure by placing higher values on the edges inside the communities, without losing their actual weight. This is then visualized in a graph using ggraph (Pedersen, 2022).
Networks
First Network
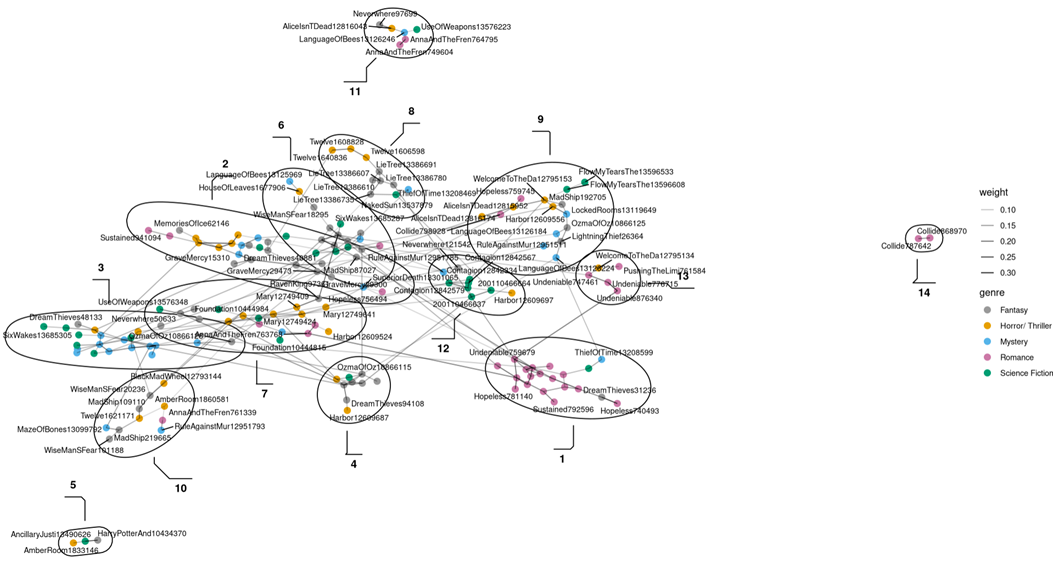
After computing the network, there are 14 clusters ranging from two to 24 reviews per cluster. While overall the network does not exhibit a clear structure, the biggest clusters hint at a relationship between genre and text similarity. In this regard, the most obvious example is cluster 01, containing 85 percent Romance reviews, but also cluster 03, where half of the reviews belong to the Mystery genre. Although there seem to be clusters dominated by the Fantasy genre, one has to keep in mind that it is the genre that is best represented in the network. Furthermore, a closer examination of the clusters containing Fantasy gave the impression that the Fantasy reviews did not quite fit into the clusters in which they were included without showing a coherent structure in themselves. One explanation for this might be that after removing all of the Fantasy books that shared genre descriptions with the rest of the genres under investigation, the remainder of these books are so versatile that they neither share a common review style nor fit with the other genres. Another reason might be the unique themes and plot points not included in the data cleaning that cause overfitting amongst reviews of the same title but not with similar reviews. This is why the Fantasy reviews were taken out and the network analysis was re-run.

Second Network
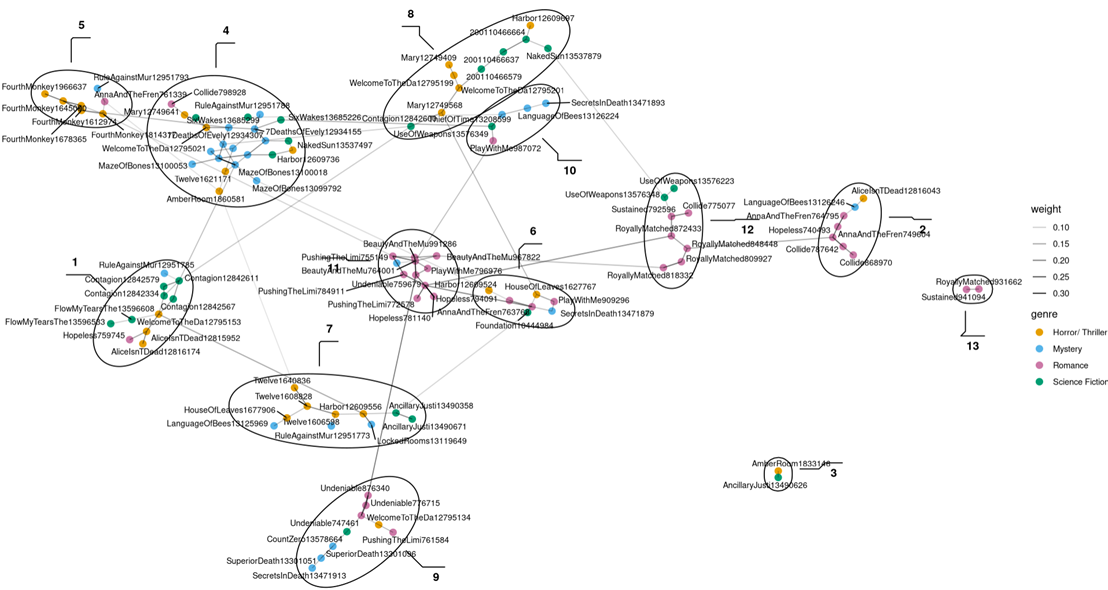
The elimination of Fantasy came with the loss of a lot of data, but this also makes the new network much more overseeable. Even though this network has one fewer cluster than the one before, the overall clusters, except for the Mystery cluster, are now much smaller. While the Mystery cluster stayed relatively stable, the Romance cluster that was observable in the last network was split up into several smaller clusters.

For further analysis it was decided to further examine six of the clusters, namely the five biggest clusters (04, 11, 01, 08, 07), as well as cluster 12, which is the second biggest Romance cluster. The latter was inspired by the question as to why the Romance cluster that could have been observed before split up. Each of these six examined clusters show a dominance of at least 50 percent in one genre (except for cluster 08 which is split halfways between Horror/Thriller and Science Fiction). The following tables show the composition of the clusters in terms of the percentages of genres the clusters consist of and the percentage of a genre inside a cluster compared to all the reviews of that genre in the network.